Debt facilities
Note – the figures below are updated twice a year at H1 and Year End.
| £m | £m | Maturity | |
|---|---|---|---|
| 1.5% unsecured convertible bonds | 175.0 | June 2025 | |
| 6.5% secured bonds | 175.0 | March 2026 | |
| 1.875% unsecured green bonds | 350.0 | November 2031 | |
| 2.68% unsecured private placement notes | 55.0 | January 2026 | |
| 3.46% unsecured private placement notes | 30.0 | May 2028 | |
| 4.41% unsecured private placement notes | 25.0 | January 2029 | |
| 2.87% unsecured private placement notes | 93.0 | January 2029 | |
| 2.97% unsecured private placement notes | 50.0 | January 2031 | |
| 3.57% unsecured private placement notes | 75.0 | May 2031 | |
| 3.09% unsecured private placement notes | 52.0 | January 2034 | |
| 4.68% unsecured private placement notes | 75.0 | January 2034 | |
| 3.99% secured loan | 83.0 | October 2024 | |
| Other loans¹ | 20.0 | n/a | |
| Non-bank loans | 1,258.0 |
||
| Club revolving credit - unsecured² | 450.0 | October 2026 | |
| Bilateral revolving credit - unsecured | 100.0 | November 2027 | |
| Committed bank facilities | 550.0 | ||
| At 30 June 2023 | 1,808.0 |
¹No fixed repayment date
²Includes £300m green tranche
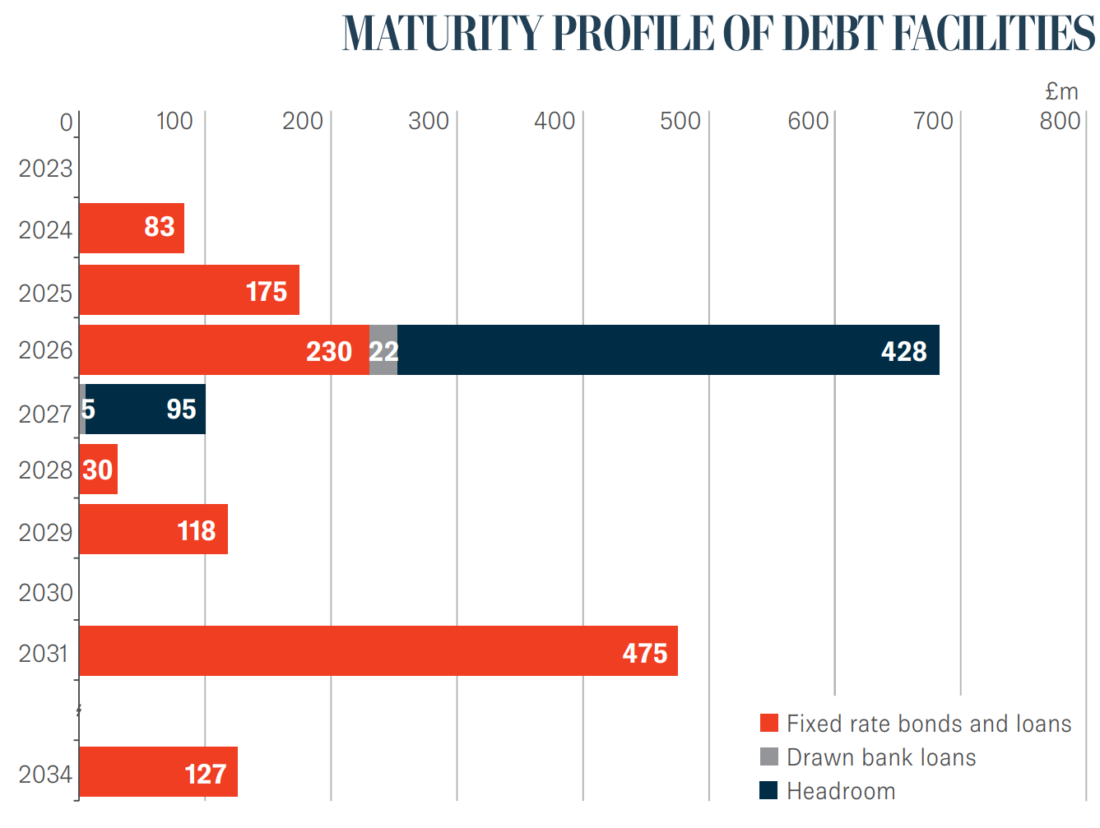
The maturity profile of these facilities is shown graphically below:
Maturity profile of debt facilities (as at 30 June 2023):
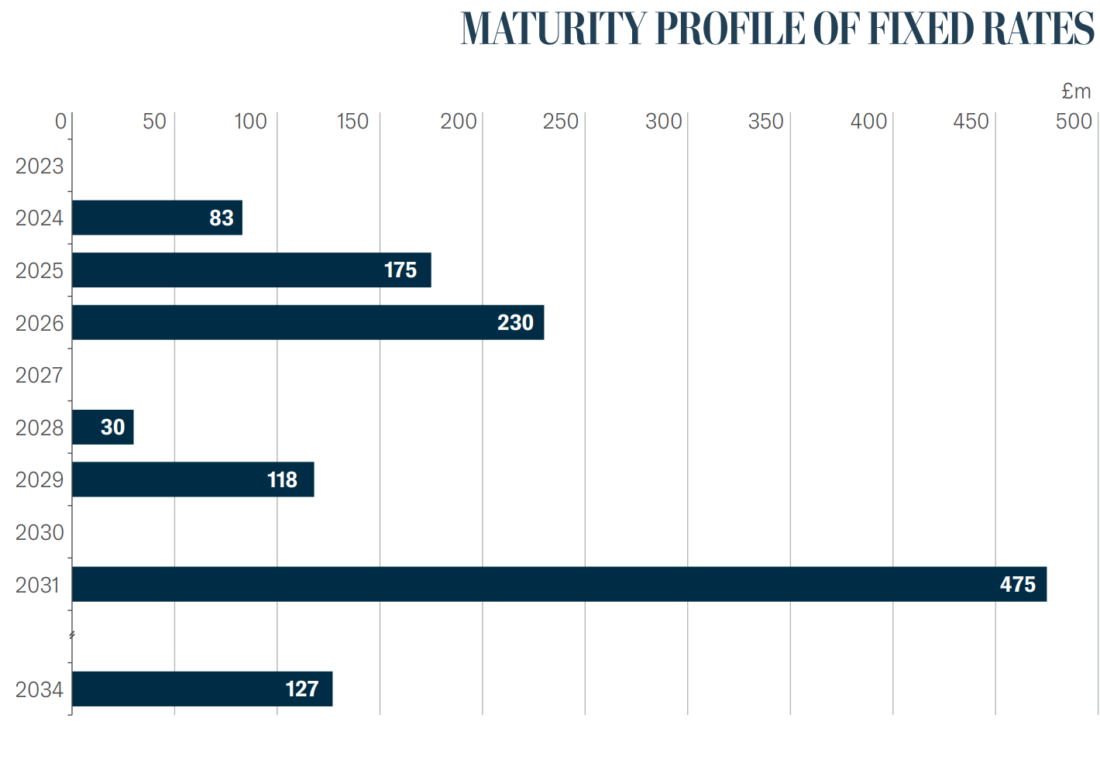
The structure of our loans and the use of interest rate hedging together provide protection against changes in interest rates. The profile of fixed rates and swaps is shown below:
Maturity profile of fixed rates and swaps (as at 30 June 2023):
¹Excludes forward-start swaps
Our net debt and key debt ratios are shown below:
Net debt
| Jun 2023
£m | Dec 2022 £m |
||
|---|---|---|---|
| Bank facilities | 27.5 | 0.0 |
|
| 3.99% secured loan 2024 | 83.0 | 83.0 | |
| 6.5% secured bonds 2026 | 175.0 | 175.0 | |
| 1.5% unsecured convertible bonds 2025 | 175.0 | 175.0 | |
| 1.875% unsecured green bonds 2031 | 350.0 | 350.0 | |
| 2.68% unsecured private placement notes 2026 | 55.0 | 55.0 | |
| 3.46% unsecured private placement notes 2028 | 30.0 | 30.0 | |
| 4.41% unsecured private placement notes 2029 | 25.0 | 25.0 | |
| 2.87% unsecured private placement notes 2029 | 93.0 | 93.0 | |
| 2.97% unsecured private placement notes 2031 | 50.0 | 50.0 | |
| 3.57% unsecured private placement notes 2031 | 75.0 | 75.0 | |
| 3.09% unsecured private placement notes 2034 | 52.0 | 52.0 | |
| 4.68% unsecured private placement notes 2034 | 75.0 | 75.0 | |
| Other loans | 20.0 | 19.7 |
|
| Acquired fair value of secured bonds less amortisation | 5.8 | 6.5 | |
| Equity components and unwinding of discounts on convertible bonds | (2.6) | (3.3) | |
| Unamortised discount on unsecured green bonds | (1.6) | (1.7) | |
| Leasehold liabilities | 34.8 | 35.0 |
|
| Unamortised issue and arrangement costs | (8.8) | (10.1) | |
| Cash at bank excluding restricted cash | (39.1) | (26.9) | |
| Net debt | 1,274.0 | 1,257.2 |
Gearing and interest cover ratio
| Jun 2023 % | Dec 2022 % |
||
|---|---|---|---|
| EPRA Loan-to-value ratio | 25.0 | 23.9 | |
| NAV gearing | 32.9 | 30.8 | |
| Net interest cover ratio¹ | 411 | 423 |
¹ Including share of joint ventures
Debt summary
| Jun 2023
£m | Dec 2022 £m | |
|---|---|---|
| Bank loans | ||
| Floating rate | 27.5 | 0.0 |
| 27.5 | 0.0 | |
| Non-banking debt | ||
| Fixed rate secured loan 2024 | 83.0 | 83.0 |
| Fixed rate secured bonds 2026 | 175.0 | 175.0 |
| Fixed rate unsecured convertible bonds 2025 | 175.0 | 175.0 |
| Fixed rate unsecured green bonds 2031 | 350.0 | 350.0 |
| Fixed rate unsecured loan 2026 | 55.0 | 55.0 |
| Fixed rate unsecured loan 2028 | 30.0 | 30.0 |
| Fixed rate unsecured loan 2029 | 25.0 | 25.0 |
| Fixed rate unsecured loan 2029 | 93.0 | 93.0 |
| Fixed rate unsecured loan 2031 | 50.0 | 50.0 |
| Fixed rate unsecured loan 2031 | 75.0 | 75.0 |
| Fixed rate unsecured loan 2034 | 52.0 | 52.0 |
| Fixed rate unsecured loan 2034 | 75.0 | 75.0 |
| Other loans | 20.0 | 19.7 |
| 1,258.0 | 1,257.7 | |
| Total debt (nominal values) | 1,285.5 | 1,257.7 |
| Hedging profile (%) | ||
| Fixed | 98 | 100 |
| Swaps | - | - |
| Floating | 2 | - |
| 100 | 100 | |
| Percentage of debt that is unsecured (%) | 80.0 | 79.5 |
| Percentage of non-bank debt (%) | 98.0 | 100.0 |
| Weighted average interest rate (%) - cash basis | 3.19 | 3.14 |
| Weighted average interest rate (%) - IFRS basis | 3.32 | 3.26 |
| Weighted average maturity of facilities (years) | 5.0 | 5.5 |
| Weighted average maturity of borrowings (years) | 5.6 | 6.2 |
| Unutilised facilities and cash | 562 | 577 |
| Uncharged properties | 4,445 | 4,600 |